
How to graph quadratics on Desmos
A parabola wears all its answers on its face. Once it's on the screen, the vertex, the roots, and the axis of symmetry are all a single click away — no completing the square, no quadratic formula.
Graph the quadratic as y = ax^2 + bx + c. Click the vertex to read the maximum or minimum — and its x-value is the axis of symmetry. Click each x-intercept to read the roots (the solutions). The vertex's y-value is the minimum value when the parabola opens up, or the maximum when it opens down. Every key feature comes straight off the graph.
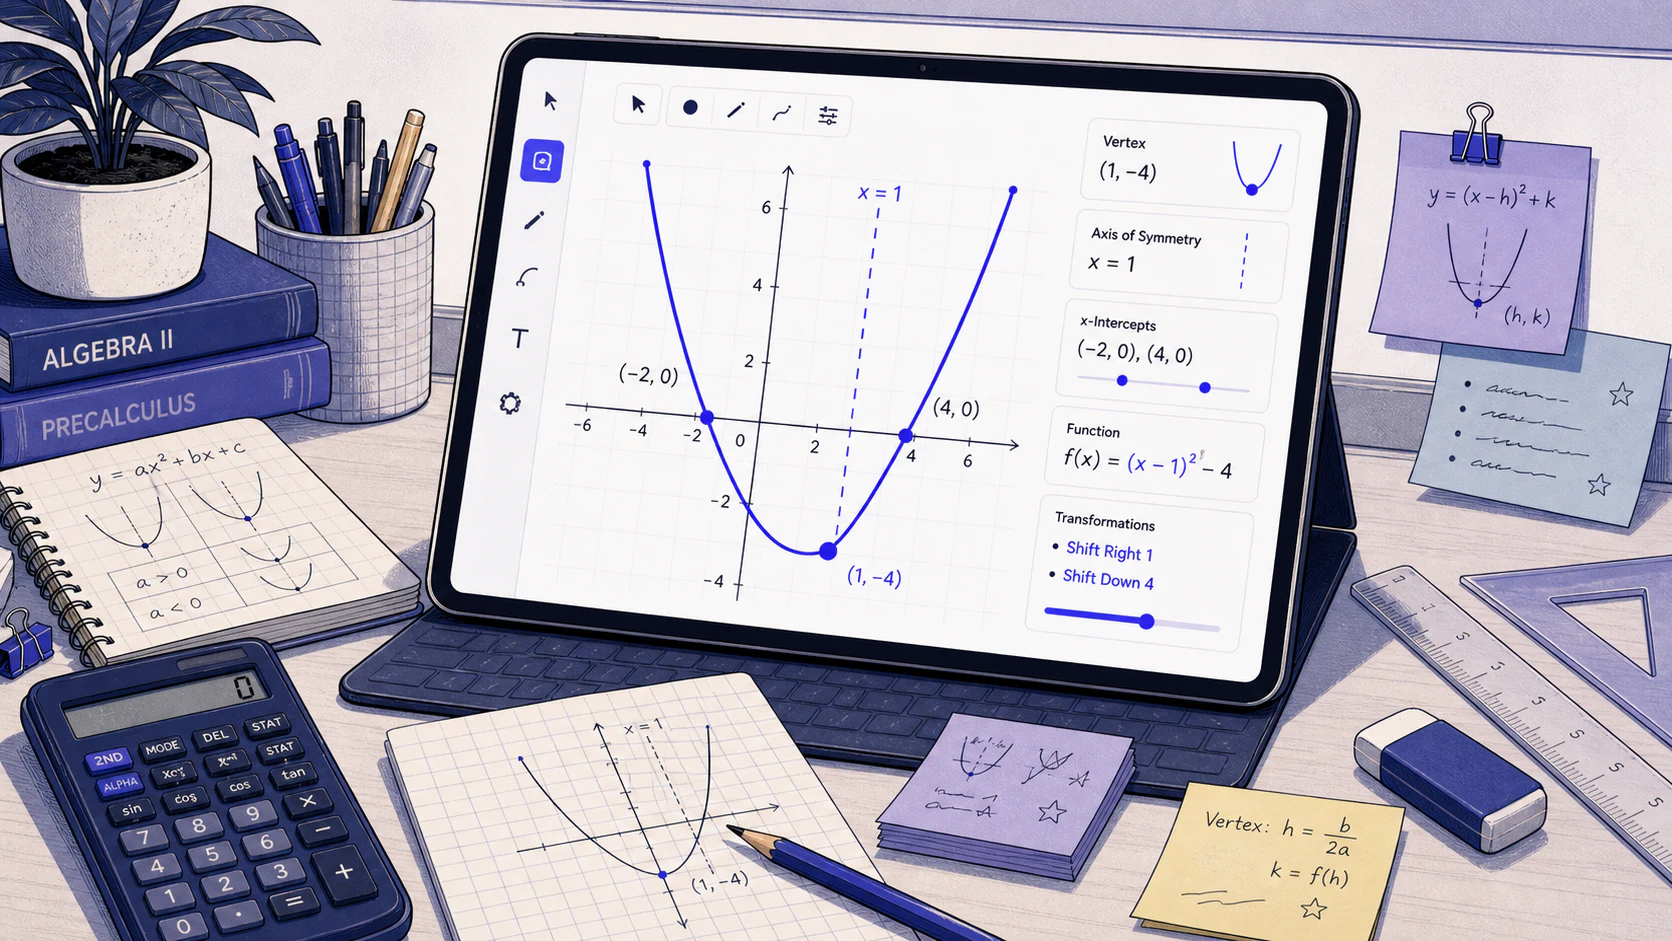
Graph it, then click each feature
One quadratic on the screen answers vertex, roots, axis-of-symmetry, and min/max questions — you just click the right point for each.
Graph the quadratic
Type it as written — y = x^2 - 6x + 5 — using ^ for the square. Standard, vertex, or factored form all draw the same parabola, so enter whichever you're given.
Click the vertex
Tap the parabola's turning point. Desmos rings it and shows its (x, y): the y-value is the min or max, and the x-value is the axis of symmetry.
Click the x-intercepts
Tap each spot where the curve crosses the x-axis. Those x-values are the roots — the solutions of the quadratic — read with no factoring at all.
Grab the y-intercept if asked
Need the constant term as a point? Click where the parabola meets the y-axis. Then re-read the question to see whether it wants the value, the location, or the line.
Lock the clicks into muscle memory.
Quadratics run through the Algebra and Advanced Math domains. Practice reading vertex, roots and axis on SAT-style questions with the built-in calculator.
One parabola, every answer
A single quadratic gives up its vertex, its roots, its axis, and its minimum — all by clicking.
Read every feature of y = x² − 6x + 5
Question (SAT-style). The function f is defined by f(x) = x2 − 6x + 5. What is the minimum value of f, and for what value of x does it occur?
- Graph:
y = x^2 - 6x + 5 - Click the vertex → (3, −4)
- Click the x-intercepts → (1, 0) and (5, 0)
The parabola opens up, so the vertex is the lowest point: the minimum value is −4, occurring at x = 3. From the same graph you also get the roots x = 1 and x = 5 and the axis of symmetry x = 3 (the vertex's x-value, exactly halfway between the two roots).

A max instead of a min
Question (SAT-style). The height, in feet, of a ball t seconds after it is thrown is modeled by h(t) = −16t² + 32t + 4. What is the ball's maximum height?
Graph y = -16x^2 + 32x + 4 (using x for t). Because the leading coefficient is negative, the parabola opens down, so the vertex is the high point. Click it: Desmos shows (1, 20). The ball reaches its maximum height of 20 feet at t = 1 second — read straight from the vertex, no formula required.
Where graphing a parabola wins
For vertex, max/min and root questions.
Anything that asks for the turning point, the largest or smallest value, the axis of symmetry, or the solutions is faster to click than to compute by hand.
For "value" vs "where it occurs."
The minimum or maximum value is the vertex's y-coordinate; where it happens is the x-coordinate. Mixing these up is the classic careless miss — read the question's exact wording.
When roots aren't on screen.
A wide or shifted parabola can cross the x-axis outside the default window. Zoom out to confirm whether it has two real roots, one, or none before you answer.
Quadratics on Desmos, answered
How do you find the vertex of a parabola on Desmos?
How do I find the roots of a quadratic on Desmos?
How do I read the axis of symmetry?
How do I find the minimum or maximum value?
What if the quadratic is given in vertex or factored form?
More Desmos techniques.
Turn Desmos into points.
Start free and practice SAT-style Math with the built-in calculator, until reading a parabola is a reflex.